You can import or upload your own point-based species data to the Spatial Portal. The uploaded data is treated the same as any species active layer and is only stored for the current session.
Import Points
To import points directly, on the menu select ‘Import’ and then ‘Points’.

Then enter a name (used as the layer name) and description for the data (which will be used in the layer metadata). Press the ‘Next’ button, then browse to find the CSV file containing the points.
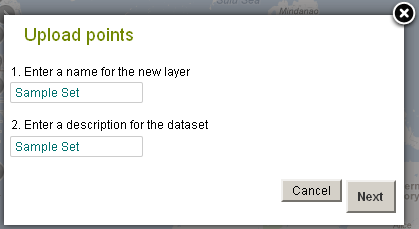
Import Points
The Spatial Portal can accept any number of points (defined minimally by an identifier, and longitude and latitude in decimal degrees). The points don’t have to be species. For example, one study wanted to map the locations of current and proposed wind farms. Up to 256 additional fields can be associated with the points. These fields can be used for faceting and filtering the records in the layer.
Select ‘Import points’ and then press the ‘Next’ button, then browse to find the CSV file containing the points.
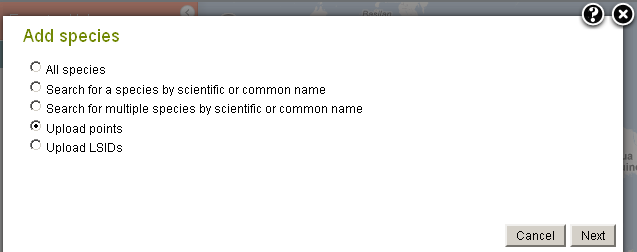
Once the points have been loaded:
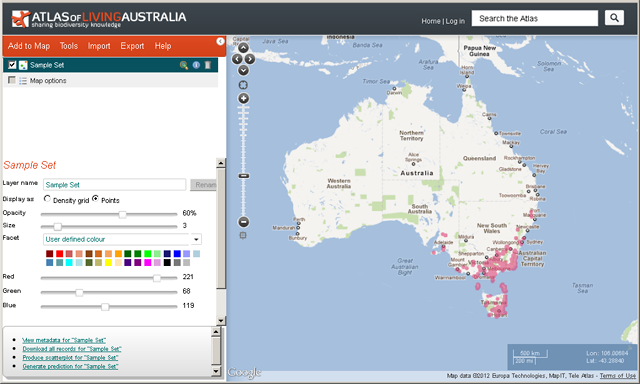
- The points are mapped
- The data is listed as a mapped layer using the name entered for the import/upload points dialogue screen, or for tools/export the name of the csv file
- Metadata will be created from the uploaded information
- The layer is available for sampling of environmental and/or contextual values, scatterplots and prediction
The CSV File
The import or upload points option uses a comma separated value (CSV) formatted file containing the following fields:
- Record identifier (any text),
- Longitude (decimal degrees),
- Latitude (decimal degrees – note negative values for south of the equator) and
- Up to 256 additional fields containing any alphanumeric values.
The first three columns are mandatory and the order cannot be altered i.e. RecordId, Longitude, Latitude. NOTE: Where more than the mandatory three columns are provided, a header row with column titles should be provided.
For example:
RecordId, Longitude, Latitude, PH, SoilDepth, Permeability, Slope
Any of the additional fields can be used to facet (display a breakdown of different groups of values) or further filter records by creating new layers. For more info »
A standard suite of contextual layer values are appended to the uploaded records. They can also be used for faceting and filtering. For more info »
The contextual layers are:
- Country boundaries
- Australian States and Territories
- LGAs (Local Government Areas)
- IBRA Regions
- IMCRA Regions
- Land use
- Vegetation types – native
- Vegetation types – present
A simple identifier and points only file example (demo_CSV_upload.csv):
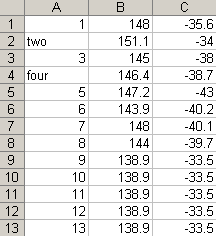
Mapped points
The points in the simple demonstration file are shown on the map below.
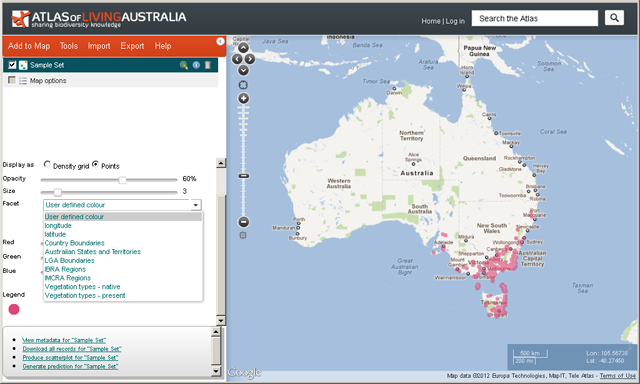
For more information on faceting and filtering »
Metadata
Clicking on the layer metadata icon ![]() icon will display a metadata summary.
icon will display a metadata summary.
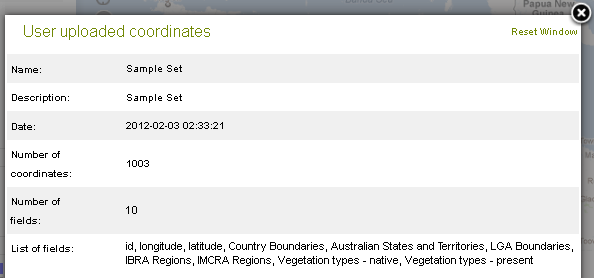
Demonstration Youtube Video
By Lee Belbin, Geospatial Team Leader